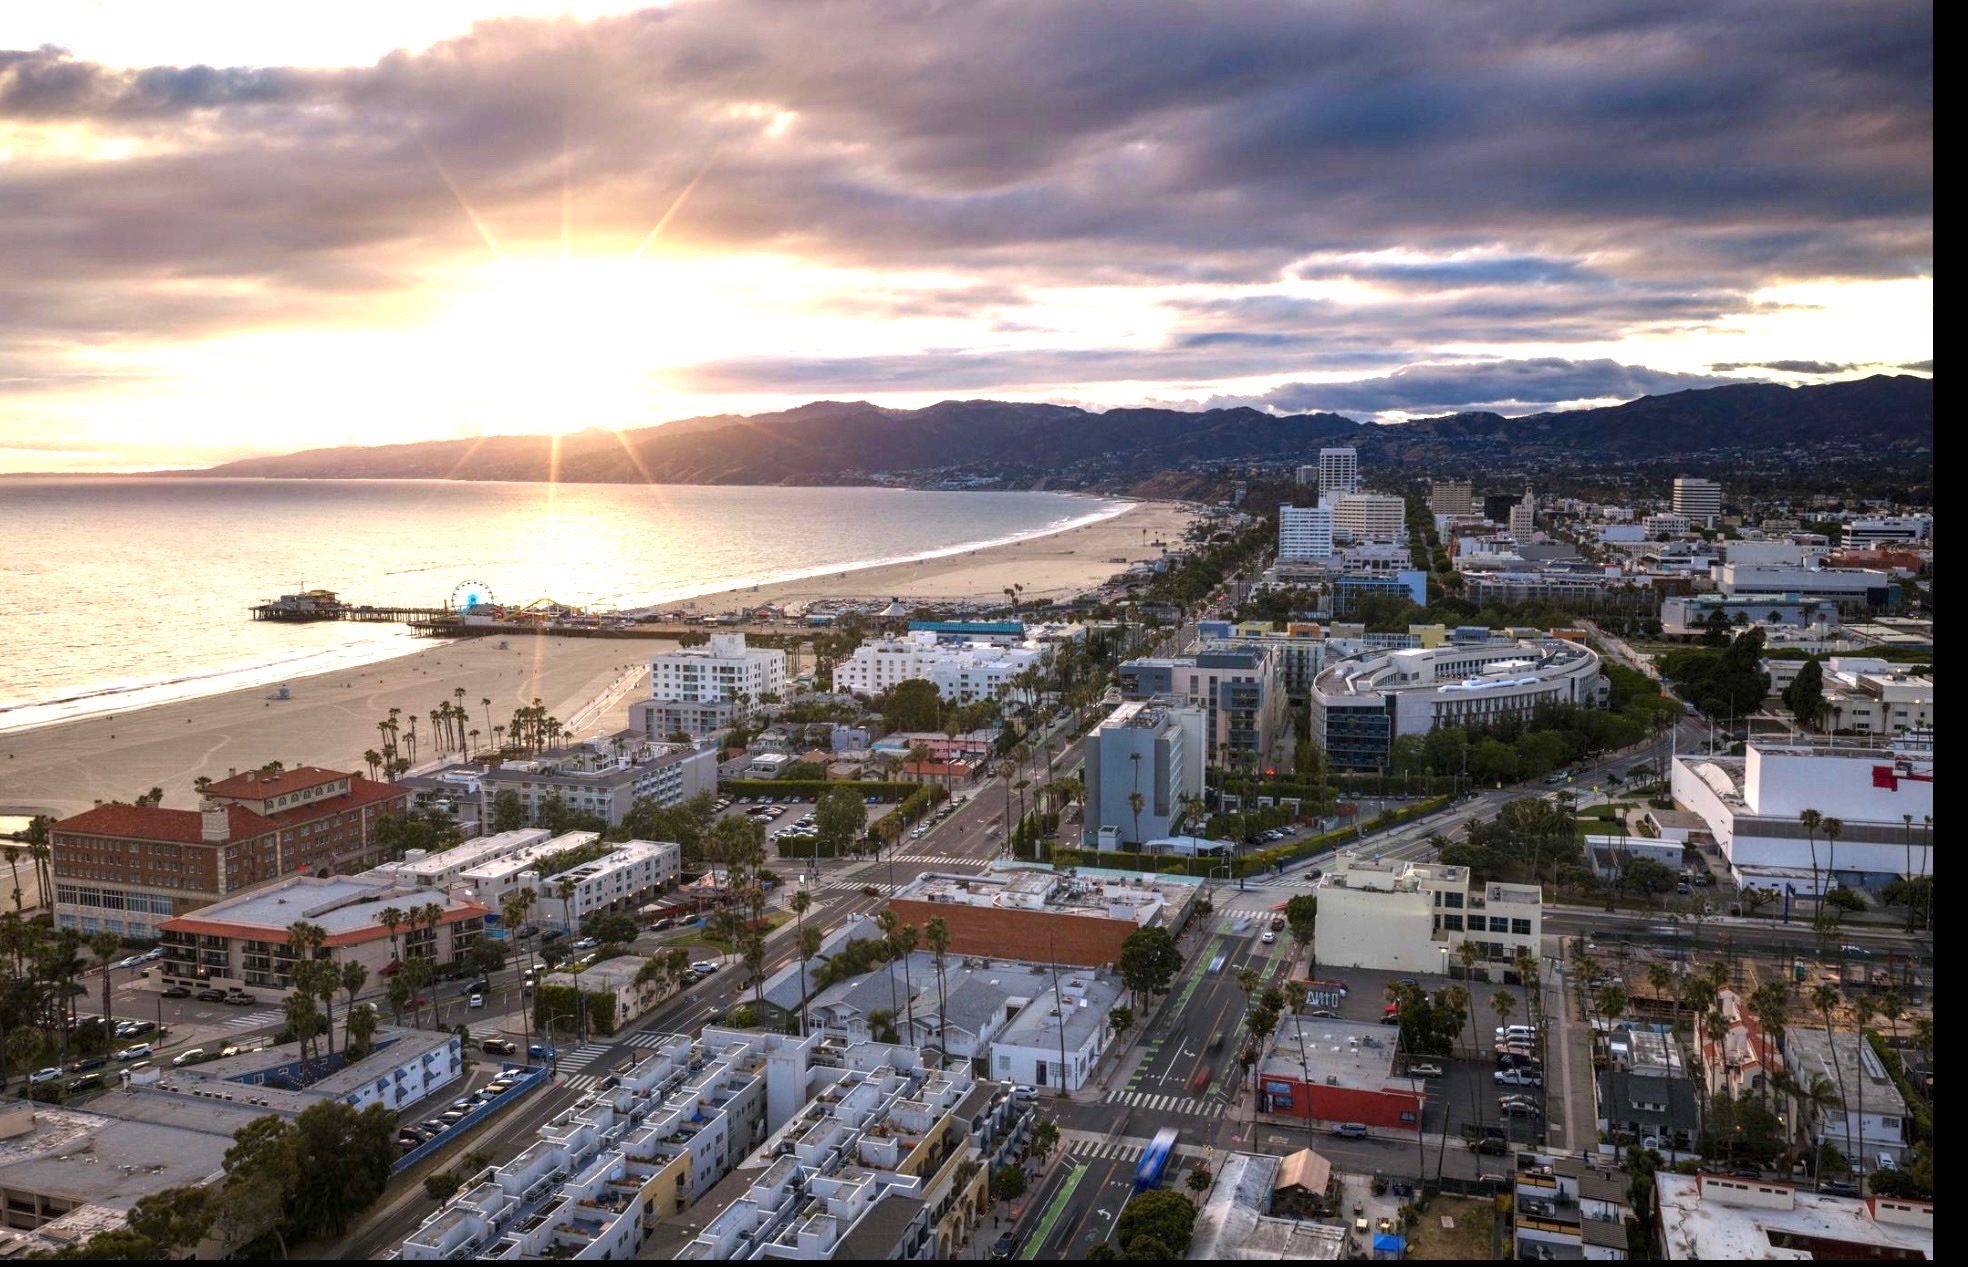
Los Angeles remains one of the most competitive multifamily markets in the country. In 2025, cap rates have stabilized after a period of compression — but the numbers vary significantly depending on submarket, vintage, and unit count. Here's what investors should know.
What Is a Cap Rate?
A capitalization rate (cap rate) is the ratio of a property's net operating income (NOI) to its current market value or purchase price. It's one of the primary metrics investors use to evaluate multifamily assets and compare opportunities across markets.
Cap Rate Formula
Cap Rate = Net Operating Income (NOI) ÷ Property Value
Example
- • Annual NOI: $100,000
- • Property Value: $2,000,000
Cap Rate = $100,000 ÷ $2,000,000 = 5%
In Los Angeles, cap rates can vary significantly by submarket. Investors often evaluate cap rates alongside factors such as location, tenant demand, barriers to entry, rent growth potential, and long-term appreciation prospects.
Prime Westside submarkets such as Santa Monica and Venice continue to attract strong investor demand due to their desirable coastal locations, limited housing supply, strong tenant demand, and long-term appreciation potential. As a result, investors are often willing to accept lower going-in yields in exchange for high barriers to entry, stable occupancy, and long-term value preservation.
2025 Cap Rate Ranges by Submarket
The Los Angeles multifamily market is highly localized. Here is a general breakdown of where cap rates are trading in 2025:
| Submarket | Cap Rate Range | Trend |
|---|---|---|
| West LA / Santa Monica | 3.5% – 4.5% | Stable |
| Downtown Los Angeles (DTLA) | 4.5% – 5.5% | Slight compression |
| Silver Lake / Los Feliz | 4.0% – 5.0% | Stable |
| Mid-City / Koreatown | 4.5% – 5.5% | Softening slightly |
| South LA / Inglewood | 5.0% – 6.5% | Value-add activity |
| San Fernando Valley | 4.5% – 5.5% | Stable |
| Long Beach | 5.0% – 6.0% | Stable to softening |
Note: Cap rates above reflect general market observations for stabilized multifamily assets in 2025. Actual cap rates vary by property condition, unit mix, rent control status, and deal structure. Contact Sandra directly for property-specific analysis.
Key Factors Shaping the 2025 Market
Interest Rate Environment
The Federal Reserve's rate posture continues to influence buyer underwriting. As financing costs stabilize in 2025, buyers are recalibrating return expectations — and the spread between cap rates and financing rates is tighter than the pre-2020 environment.
Rent Control Considerations
California's AB 1482 and LA's Rent Stabilization Ordinance (RSO) affect a significant portion of the multifamily inventory. Buildings subject to rent control carry different underwriting assumptions, typically resulting in higher cap rates demanded by buyers as a risk premium.
Value-Add vs. Core Assets
Stabilized, renovated buildings in supply-constrained submarkets continue to trade at low cap rates. Value-add opportunities — older buildings with significant rent-to-market upside — command higher cap rates, often in the 5.5%–7%+ range depending on the level of deferred maintenance and regulatory complexity.
What This Means for Buyers and Sellers
For buyers, 2025 presents a more transparent pricing environment than 2021–2022. Bid-ask spreads have narrowed, and well-priced assets are still transacting. The key is disciplined underwriting — particularly on expense growth, future rent upside, and exit assumptions.
For sellers, maximizing value requires positioning your asset correctly — both in terms of the buyer pool you attract and the story you tell about income stability and upside. An experienced agent who understands the underwriting buyers will run is essential.
Work with Sandra
Get a property-specific analysis
Market averages are a starting point. The real insight comes from understanding your specific asset — its rent profile, submarket dynamics, and where it sits relative to what buyers are underwriting today.
Contact SandraSandra Majarian | CA DRE License #02249098
Marcus & Millichap | Los Angeles, CA